


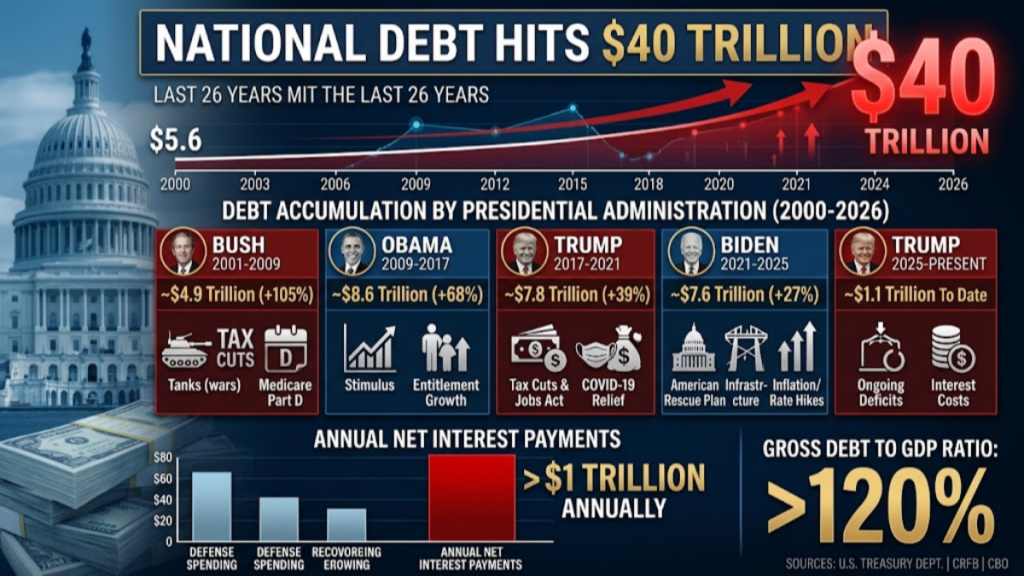
How four administrations over a quarter-century accumulated $40 trillion in gross federal debt through tax cuts, wars, economic stimulus, and entitlement growth.
WASHINGTON – In the year 2000, the U.S. national debt was $5.7 trillion. Now 26 years later, the national debt was just confirmed to be $40 trillion.
Data released by the U.S. Treasury Department confirms total federal debt reached $40.05 trillion, crossing a milestone driven by decades of bipartisan spending, expanding entitlement obligations, rising interest rates, and successive economic crises. The threshold arrives less than five months after federal borrowing topped $39 trillion, highlighting an accelerating fiscal decline that spending watchdogs warn is increasingly unsustainable.
Economists and budget experts emphasize that responsibility for the nation’s balance sheet spans both political parties over the past quarter-century. Since 2000, four presidential administrations have overseen massive expansions of the federal ledger through tax cuts, foreign wars, safety-net expansions, and multi-trillion-dollar emergency relief packages.
Debt Accumulation by Administration (2000 – Present)
The breakdown below reflects the gross national debt added during each presidential administration over the past 26 years:
- George W. Bush (2001 – 2009): Added ~$4.9 trillion (+105%)
- Primary Drivers: The post-9/11 wars in Iraq and Afghanistan, the Economic Growth and Tax Relief Reconciliation Act of 2001, Medicare Part D, and initial bank bailouts (TARP) during the 2008 Global Financial Crisis.
- Barack Obama (2009 – 2017): Added ~$8.6 trillion (+68%)
- Primary Drivers: Sustained economic recovery stimulus following the Great Recession (American Recovery and Reinvestment Act), reduced tax revenue during prolonged economic stagnation, and rising mandatory entitlement spending.
- Donald Trump – First Term (2017 – 2021): Added ~$7.8 trillion (+39%)
- Primary Drivers: The Tax Cuts and Jobs Act of 2017, increased defense and domestic discretionary spending, and emergency relief measures passed in response to the COVID-19 pandemic (including the CARES Act).
- Joe Biden (2021 – 2025): Added ~$7.6 trillion (+27%)
- Primary Drivers: The American Rescue Plan, the Infrastructure Investment and Jobs Act, the Inflation Reduction Act, expanded student loan relief measures, and sharply higher net interest costs driven by Federal Reserve rate hikes.
- Donald Trump – Second Term (2025 – Present): Added ~$1.1 trillion to date
- Primary Drivers: Ongoing mandatory baseline deficits, elevated debt-servicing costs, and policy adjustments including tariff-related shifts.
High Interest and Mandatory Spending Compound the Crisis
Beyond legislative choices, structural drivers have pushed federal borrowing into a self-reinforcing loop. Net interest payments on the public debt now exceed $1 trillion annually—surpassing total U.S. defense spending—as the government refinances legacy debt at significantly higher interest rates.
At $40 trillion, the gross national debt represents more than 120% of total U.S. Gross Domestic Product (GDP). Budget analysts warn that without bipartisan reforms to address structural deficits and mandatory entitlement trust funds, debt service costs will continue to consume an unprecedented share of the federal budget.